Monitoring Projects
The project monitoring page provides an overview of your project's usage, resource consumption, and key details.
To access the monitoring page, click on any project from your team's project list. You'll see a breakdown of usage, graphs showing activity over time, and a project summary.
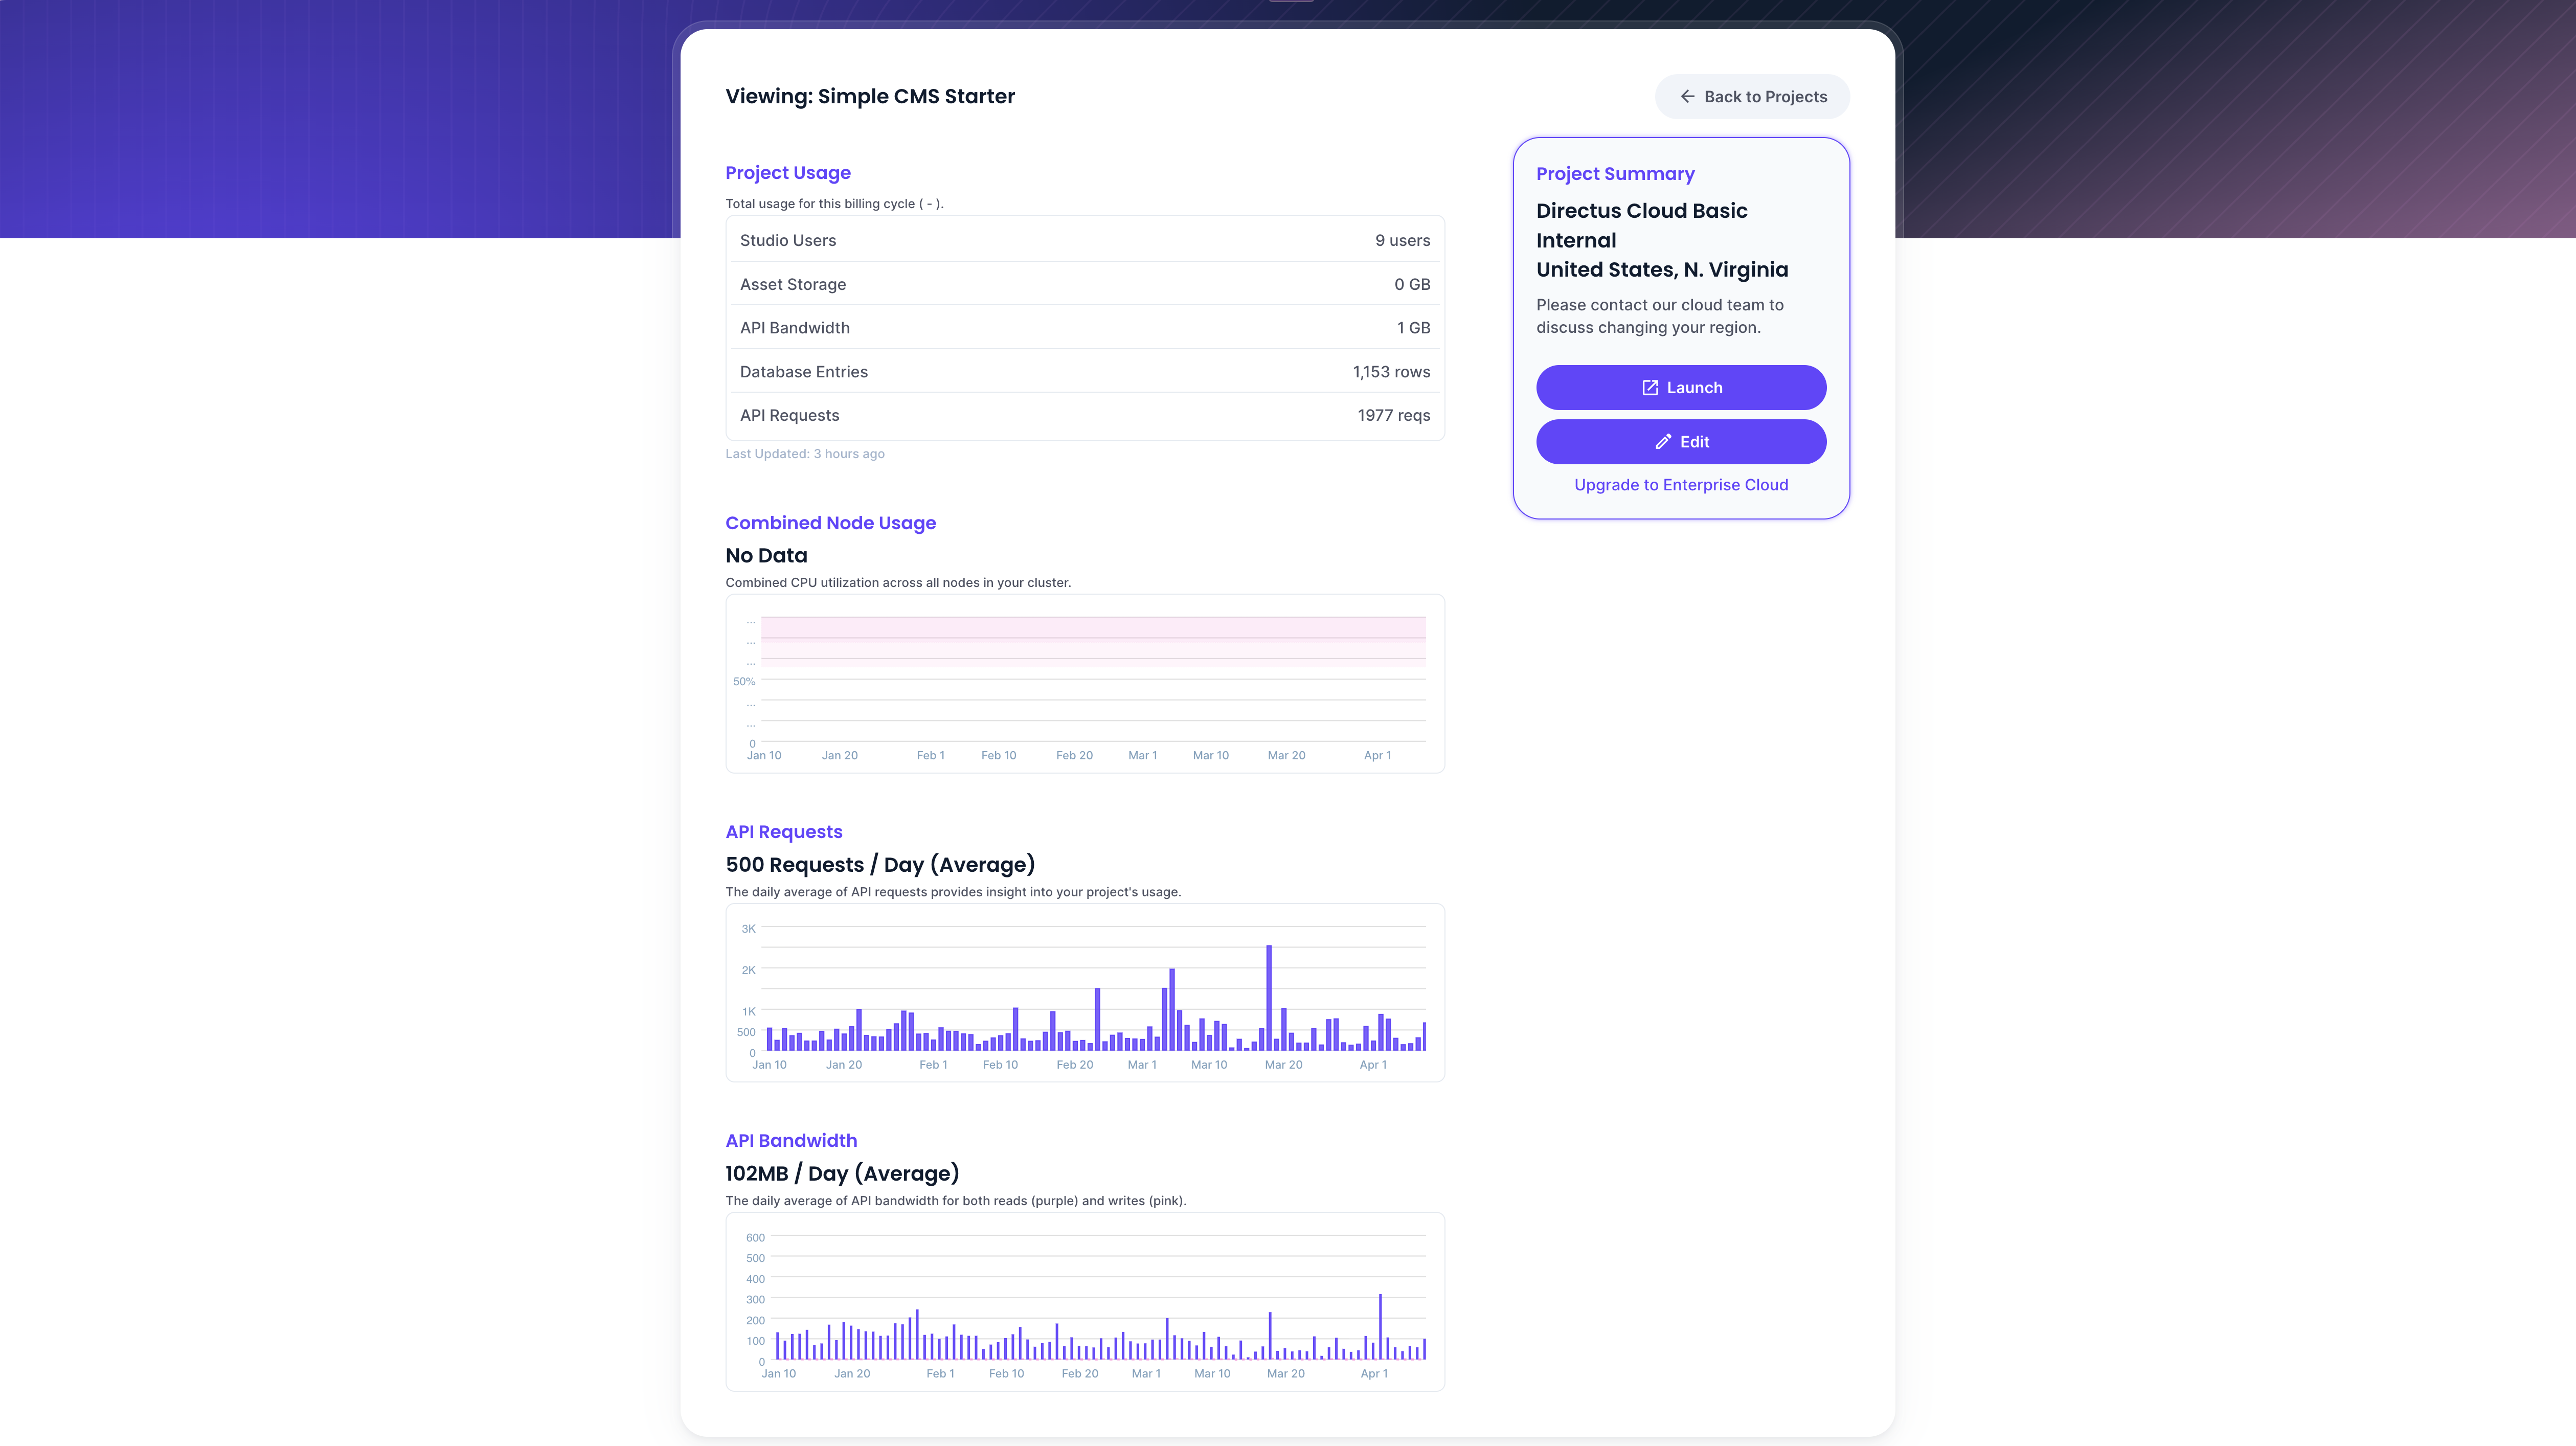
Project Usage
The top of the page displays current usage metrics for your project:
- Studio Users - Number of app users actively using the Data Studio.
- Asset Storage - Total storage consumed by uploaded files.
- API Bandwidth - Total bandwidth used by API requests.
- Database Entries - Number of items stored across all collections.
- API Requests - Total number of API requests made.
Project Summary
The project summary sidebar shows key details about your project:
- Plan - Your current Directus Cloud plan tier.
- Datacenter - The region where your project is hosted.
- Launch - Open your Directus project directly.
- Edit - Modify your project settings.
Combined Node Usage
Total load placed on all nodes. If CPU or memory usage is consistently high, consider scaling up your project.
API Requests
Daily average number of API requests over the last month. This provides insight into traffic patterns and overall usage.
API Bandwidth
Daily average read/write bandwidth of all API requests over the last month.
Get once-a-month release notes & real‑world code tips...no fluff. 🐰